ML for Data Art & Visualization: Dimensionality Reduction
Published: Apr 3, 2025

by Sylwia Nowakowska
AI
Tutorial
Python
Image Dataset
PCA
UMAP


Have you ever found yourself staring at a massive dataset, overwhelmed by countless variables, and wondering how to make sense of it for your data art or visualization project? Fortunately, Machine Learning (ML), a powerful subset of Artificial Intelligence (AI), comes to the rescue. One of its most exciting tools for tackling such challenges is dimensionality reduction, which transforms high-dimensional data into simpler, more manageable representations—usually in 2D or 3D—perfect for visualizations and creative projects.
In this article, we will explore how to apply the most widely used dimensionality reduction techniques: Principal Component Analysis (PCA) as well as Uniform Manifold Approximation and Projection (UMAP). Our journey will be accompanied by Python code, but don’t worry if coding isn’t your thing: you can access a Google Colab notebook with detailed instructions, where you can simply upload your own dataset, and the rest will be taken care of.
We will work with an AI-generated digital art dataset, serving as a perfect canvas to demonstrate how dimensionality reduction techniques can transform complex data into intuitive, low-dimensional visualizations. Figure 1 brings this concept to life—PCA arranges images based on their similarities, creating a visually intuitive map.
Ready to dive in and turn your dataset into stunning, insightful visuals? Let’s go!

Figure 1) The power of dimensionality reduction: Principal Component Analysis (PCA) positions visually similar digital art images close to each other in 2D space (images AI-generated, Adobe Firefly).
Curse of Dimensionality
As the number of variables (features or dimensions) in a dataset increases, so do the challenges—this is known as the curse of dimensionality. In high-dimensional spaces, data points become sparse, meaning they spread out and occupy a vast space with little overlap, making it harder to identify meaningful patterns or relationships. Distances lose meaning, and structures that are clear in lower dimensions become more and more hidden as the number of dimensions grows [1], [2]. This makes it harder to analyze the data and to extract the most relevant features.
Blessing of Dimensionality Reduction
Imagine trying to summarize a long novel into a short paragraph without losing its essence—that’s what dimensionality reduction does for datasets. By reducing the number of variables, while preserving the most critical information, it helps transform complex data into compact representations that are easier to interpret and visualize [3].
Choosing the right dimensionality reduction method depends on your dataset's structure and the level of detail you wish to preserve in your visualizations. Techniques like PCA, t-distributed stochastic neighbor embedding (t-SNE), and UMAP each offer distinct advantages. While PCA prioritizes capturing the global structure of the dataset, ensuring that the overall relationships between data points are maintained, t-SNE excels at preserving the local structure by clustering similar points together. UMAP balances these approaches, retaining both local clusters and the broader relationships among distant groups [4]. Additionally, autoencoders—a type of neural network—can learn efficient, lower-dimensional representations of data, making them particularly useful when dealing with nonlinear structures or complex patterns that traditional techniques might miss [5].

Figure 2) From Chaos to Clarity – Datasets with many variables can be challenging to analyze due to the curse of dimensionality. Dimensionality reduction techniques offer a solution by simplifying data while preserving essential patterns (AI-generated, Adobe Firefly).
Principal Component Analysis (PCA)
PCA is one of the most widely used dimensionality reduction techniques, transforming high-dimensional data into a lower-dimensional space while retaining as much variance as possible. Variance, in simple terms, measures how spread out the data points are from their average value. A high variance means the data points are more dispersed, while a low variance indicates they are closer together. In PCA, preserving variance is crucial because it helps retain the most informative aspects of the data. PCA achieves this by first identifying the axis, i.e., the first principal component (PC) that accounts for the largest amount of variance in the data. Subsequently, it finds the second PC, orthogonal (i.e., at the right angle) to the first, that captures the largest amount of the remaining variance, and so on [6]. The PCs are linear combinations of the original features, effectively summarizing the data in a new, more manageable coordinate system, revealing a spatially organized representation.
For example, PC1 and PC2 might be expressed as:
PC1 = 0.60 × brushstroke_density + 0.20 × color_saturation + 0.15 × texture_complexity
PC2 = 0.50 × texture_complexity + 0.10 × brushstroke_density + 0.05 × color_saturation
The coefficients in each PC indicate each original feature's weight (importance) in forming the new dimensions.
If you are interested in learning more about PCA, there is an excellent Statquest video by Josh Starmer [7].

Figure 3) Conceptual illustration of Principal Component Analysis (PCA), showing the computation of the first two Principal Components (PCs).
Uniform Manifold Approximation and Projection (UMAP)
Unlike PCA, which focuses on linear relationships, UMAP excels at capturing complex, non-linear patterns. It constructs a high-dimensional graph representation of the data and then optimizes a low-dimensional graph to be as structurally similar as possible [8]. This ability to maintain nuanced relationships between data points allows the creation of more accurate and compelling representations, especially when dealing with high-dimensional data that defy linear simplification.
If you're interested, another StatQuest video explores the inner workings of UMAP [9].
Data Format
Working with 1D Samples
To apply dimensionality reduction techniques like PCA or UMAP, your dataset should be structured to represent each sample as a 1D vector of numerical features. This means that for every sample, the data should follow a format such as [feature 1, feature 2, feature 3, …, feature n].
Common examples of datasets readily available in this form include:
Tabular data, such as the well-known Iris dataset, where each row represents a flower with numerical measurements of its petals and sepals [10].
Spectroscopy data, where each sample corresponds to a spectrum, with energy bins serving as features. An example of such a dataset is the near-infrared spectra of pharmaceutical tablets [11].
Text embeddings, where words or documents are transformed into numerical vectors capturing semantic relationships. The embeddings can be created with various ML techniques, like word2vec [12], GloVe [13], and transformer-based approaches like BERT [14], Gemini Embedding text model [15], or Open’s AI text-embedding-ada-002 [16].

Figure 4) Examples of datasets with 1D samples instantly usable for dimensionality reduction: tabular data represented by the Iris dataset [10]; spectral data represented by the near-infrared spectra of pharmaceutical tablets [11]; and text embeddings calculated with all-MiniLM-L6-v2 model [17].
However, some datasets, such as audio signals or time series data, may contain 1D samples of varying lengths. In such cases, a common preprocessing step is to either pad shorter sequences with zeros or truncate longer ones to a fixed length. Alternatively, feature extraction techniques can be applied to create uniform-length representations. For example, Fourier or wavelet transform can convert signals into frequency components, highlighting patterns that may not be visible in the raw data. In audio processing, Mel-Frequency Cepstral Coefficients (MFCCs) are widely used to capture the spectral characteristics of sound, creating a compact representation ideal for dimensionality reduction [18]. These transformations help structure the data into consistent numerical vectors, making them compatible with PCA, UMAP, or other techniques.
Pre-processing 2D or Higher Dimensionality Samples
Many datasets encountered in data art and visualization consist of samples constituting 2D structures, such as images or time-series data with multiple channels. Unlike simple 1D feature vectors, these datasets have spatial or temporal relationships that carry valuable information. To apply dimensionality reduction techniques, we need strategies that preserve these structures while transforming the data into a suitable format.
Flattening (Vectorization)
The simplest approach is to flatten each 2D sample into a 1D vector. For an image of shape (rows, columns), this means reshaping it into a vector of length (rows × columns). Once flattened, standard dimensionality reduction methods like PCA or UMAP can be applied. However, this method disregards spatial or temporal relationships, potentially losing essential patterns in the data. While useful for quick preprocessing, it may not always be the best approach for visualizations that rely on structural integrity.
Feature Extraction
Instead of flattening, extracting meaningful features from 2D data provides a more structured approach. For image datasets, features such as texture, edges, and statistical properties (mean, variance) can be derived using convolutional filters or deep learning techniques like Convolutional Neural Networks (CNNs) without the final classification layer. Time-series data with multiple channels can be transformed by extracting per-channel statistics and inter-channel relationships, ensuring that important temporal dependencies remain intact. This approach ensures that essential properties are retained, making the data more suitable for creative and analytical visualizations.
Convolutional Autoencoders (CAEs)
Convolutional Autoencoders (CAEs) provide another advanced approach, particularly for image data. By leveraging convolutional layers, CAEs learn a compressed representation of multidimensional samples while preserving spatial relationships. This learned representation, often of much lower dimensionality, can then be used for visualization or further ML tasks. Since autoencoders adapt to the underlying structure of the dataset, they offer a highly effective way to reduce dimensionality while maintaining essential visual and contextual information [19].

Figure 5) Examples of 2D samples requiring pre-processing before applying dimensionality reduction techniques: time-series data, represented by the signals collected from a wearable device (Troika [20] dataset); and image datasets represented by AI-generated digital art (Adobe Firefly).
By choosing the right strategy for your dataset—whether flattening, feature extraction, or neural networks—you can ensure that dimensionality reduction enhances rather than distorts the original structure.
Dimensionality Reduction in Python
Now, let’s dive into the practical implementation of PCA and UMAP in Python for our digital art dataset containing images generated with Adobe Firefly [21]. This approach, however, is also applicable to much bigger image datasets [22], and to other data types, which can be represented as a 1D vector.

Figure 6) Simple digital art dataset consisting of 25 Images from Adobe Firefly [21]. Images generated with the same prompt are in the same row.
Dataset
For the dataset generation, seven different prompts were used, and for each prompt, 3-4 images were chosen (Fig. 6). In the next step, a deep learning vision model was used to extract features, resulting in each image being described by 1000 numeric values (features).
In the code snippet below, the obtained dataset is loaded to a pandas DataFrame:
Filename | Category | Feature_0 | Feature_1 | … | Feature_1000 |
|---|---|---|---|---|---|
Art_01.jpg | 1 | 0.38 | 0.14 | -0.03 | |
Art_02.jpg | 1 | 0.43 | 0.22 | -0.04 | |
Art_03.jpg | 1 | 0.19 | 0.08 | -0.08 | |
Art_04.jpg | 1 | 0.46 | 0.06 | 0.00 | |
Art_05.jpg | 1 | 0.44 | 0.23 | 0.10 |
Scaling
Before reducing dimensionality, it’s important to scale the dataset so that all features have a similar range. Otherwise, features with larger values can overpower smaller ones, distorting the results and leading to misleading visual patterns. Scaling helps ensure that every feature contributes fairly, making the results more accurate and meaningful.
A simple way to scale data is by using StandardScaler from Python’s sklearn library [23], which adjusts all features to have the same mean and standard deviation, ensuring a balanced contribution of each:
PCA
After scaling, the dataset is ready for PCA [24]. The parameter n_components determines how many principal components (PCs) to keep, and its maximum value is: n_components = min(n_samples, n_features).
In this example, we set n_components=10, meaning we keep 10 PCs out of 25. We store the results in a new DataFrame for easy analysis and visualization.
Note: No information about the image category is passed to PCA. Only the features describing each image.
PC 1 | PC 2 | PC 3 | … | PC 10 | |
|---|---|---|---|---|---|
0 | 7.3157 | -20.9818 | 2.6158 | -4.3628 | |
1 | 3.8106 | -18.3110 | 5.6535 | 0.0395 | |
2 | 7.8435 | -16.2960 | -0.5637 | 7.6728 | |
3 | 8.9746 | -18.7964 | 2.3930 | -3.3074 | |
4 | 14.4296 | 8.0609 | -12.5816 | -1.0175 |
After performing PCA, we’ll assess how much variance each of the top 10 PCs accounts for using the explained variance ratio. This ratio represents the proportion of total variance captured by each PC, helping us determine their relative importance. A higher explained variance ratio indicates that a component captures more of the dataset’s structure. The plot below shows the individual explained variance ratios and their cumulative sum, illustrating how much total variance is retained as more components are included. This visualization is crucial for deciding the optimal number of PCs to keep for further analysis or visualization without losing significant information.

Figure 7) PCA: Explained variance ratio plot in first 10 principal components (PCs).
In our example, the 1st PC explains 21% of the variance, the 2nd PC 17%, and the 3rd PC 13%. This means that in a 2D PCA plot, 38% of the variance will be reflected, while in a 3D plot, it will be 51%. With that information in mind, let’s go ahead and plot the PCA projections, using the function scatter_plot defined below:
First, let’s call the scatter_plot function to generate a 2D PCA projection of the dataset. Since our dataset is labeled with the prompt #, we can pass dataset_df['category'] to the category argument to color the points accordingly.
Note:
If your dataset is not labeled, set
category=None.If you want to annotate the points in the plot, pass a list of labels to the
annotationsargument.

Figure 8) PCA: 2D projection plot.
Awsome! In the 2D PCA projection, capturing 38% of the variance, the points representing visually similar images created with the same prompt are placed close to each other! Let’s see how the projection looks in 3D, where 51% of variance is represented. All we need to do is to change the plot_dimensionality argument to '3D':

Figure 9) PCA: 3D projection plot.
Additionally, a GIF with Python’s matplotlib and PIL libraries can be produced for dynamic 3D exploration.
Figure 10) PCA: animated 3D projection plot.
The 3D plots reveal an even better separation of the points representing images created with different prompts, demonstrating the power of PCA coupled with a deep learning computer vision model for image feature extraction, for clustering digital artworks.
UMAP
Now, let’s examine how UMAP performs dimensionality reduction on our dataset. Unlike PCA, which relies on linear transformations, UMAP offers greater flexibility through its key parameters—n_neighbors and min_dist. These parameters allow for fine-tuning the balance between preserving local and global structures, enabling more control over how the data is projected into lower dimensions [8], making UMAP particularly useful for capturing complex patterns in the data that PCA may overlook.
The
n_neighborsparameter defines the number of nearest neighbors considered when constructing the high-dimensional graph. A lower value prioritizes local structure, capturing fine-grained details by focusing on closer relationships within the data. A higher value shifts the emphasis toward global structure, ensuring a more holistic view of the dataset at the cost of local detail [8].The
min_distparameter determines the minimum spacing between points in the lower-dimensional space. A smaller value results in tightly clustered embeddings, preserving local density and emphasizing fine-scale patterns. Conversely, a larger min_dist spreads points more evenly, promoting a clearer separation of broader structures [8].
As the parameters significantly influence the results, creating a matrix plot to analyze which parameter combinations lead to the most desirable projection is highly recommended. The code below generates a matrix of scatter plots, visualizing the impact of chosen n_neighbors and min_dist values on the data's separation. Given the inherent randomness in the UMAP algorithm, it’s advisable to run the code multiple times and compare the resulting outputs to distinguish the effects of hyperparameters from random variation before making any conclusions.

Figure 11) UMAP: 2D projections with varying values of
n_neighborsandmin_dist.
As you can see from the matrix of UMAP scatter plots above, in nearly all of them the data points related to the same category are placed near each other. The resulting visualizations vary greatly depending on the combination of the n_neighbors and min_dist parameters:
When using low values for
n_neighbors, such as 2, the clusters appears compact with some points from the same category placed further apart, as the algorithm focuses on local structures. However, starting fromn_neighbors=5, the relationship between points within the same category becomes more apparent, with neighboring points clustering together more effectively. As the number of neighbors increases, the visualization becomes more uniform, emphasizing the global structure of the data.Adjusting the
min_distparameter also affects the uniformity of the plot. A smallermin_distleads to tightly clustered points, accentuating finer details within the data. As themin_distvalue increases, the points are more evenly spaced, promoting a broader separation of structures, which is particularly noticeable when low values ofn_neighborsare used.
Now, let’s choose one parameter combination, namely n_neighbors=10 and min_dist=1.0, and look at the plot in 3D.
Figure 12) UMAP: dynamic 3D projection plot.
Similar to PCA, the 3D UMAP projections reveal even clearer clustering compared to the 2D projections.
Feel free to experiment with different parameter values to find the combination that works best for your dataset!
To Code or Not To Code – That Is The Question...
If you want to include dimensionality reduction techniques in your creative toolbox, you can choose whether you want to dive into coding, offering more flexibility and customization, or if you prefer to leverage no-code solutions that allow you to bring your creative vision to life without writing a single line of code.
Coding Approach
To start with coding, there are different options depending on your workflow, the scale of the datasets, and the size of the AI models you plan to work with. You can either work locally or in the cloud. Your computer/laptop might be sufficient for smaller datasets and models, but the cloud could be required for larger ones.
Coding Locally
The simplest option is to install Python on your computer [25], along with an Integrated Development Environment (IDE) like Visual Studio Code [26]. If you prefer a more interactive environment, Jupyter Notebook is a very popular tool in the coding community [27]. It allows you to separate your code into cells, enabling you to execute them independently from the rest of your code, making the development process smoother and more organized. Visual Studio Code offers a Jupyter extension [28], allowing for seamless integration of Jupyter Notebooks directly within the IDE, so you can enjoy the benefits of both interactive coding and a fully-featured development environment.
For even greater flexibility, you can work with Anaconda environments [29]. Anaconda helps you manage dependencies, packages, and environments, making it easier to handle different projects that might require different setups. It ensures that each project has its own isolated environment, avoiding conflicts between libraries and simplifying the process of managing various tools needed for different projects.
Coding in Cloud
Working in the cloud offers significant advantages for more demanding tasks, especially those involving large datasets or complex AI models. Cloud platforms provide access to powerful computing resources, including high-performance CPUs and GPUs, without the need for expensive hardware investments. One accessible example is Google Colaboratory (Colab) [30].
Colab is a cloud-based Jupyter notebook environment that requires no setup, runs entirely in your browser, and is free to try. It's readily available with a Google account, making it incredibly easy to start. Colab provides access to free GPUs, which are essential for accelerating computationally intensive tasks. However, it's important to note that Colab offers limited GPU quotas, and usage is subject to availability. To overcome these limitations and access more consistent and powerful resources, Google Colab also offers paid options.
Beyond Google Colab, platforms like Amazon SageMaker [31], Microsoft Azure [32], and IBM Cloud [33] offer robust cloud-based environments with varying strengths in GPU access, collaborative features, and enterprise-level tools.
No-code Approach
While this tutorial was accompanied by code, you don’t need coding skills to begin using dimensionality reduction and other Machine Learning techniques in your creative work. No-code tools are opening up AI experimentation to all. Take Orange [34], for example—it offers an intuitive drag-and-drop interface that lets you build data analysis workflows, enabling you to easily perform tasks like preprocessing, visualization, dimensionality reduction (PCA, t-SNE), clustering, and even training simple neural networks—all by connecting modular components.
Dimensionality Reduction: Limitations
It’s important to consider the trade-offs of dimensionality reduction. While these techniques make data easier to analyse and visualize, they can also introduce some degree of information loss, potentially omitting subtle details. Furthermore, interpretability varies across methods—PCA provides clearly interpretable principal components, whereas UMAP creates abstract embeddings, making the size of clusters and the distance between them essentially meaningless [8]. Understanding these nuances allows you to strike the right balance between clarity and complexity when applying dimensionality reduction to your visualization or data-driven artwork.
Dimensionality Reduction for Data Art & Visualization
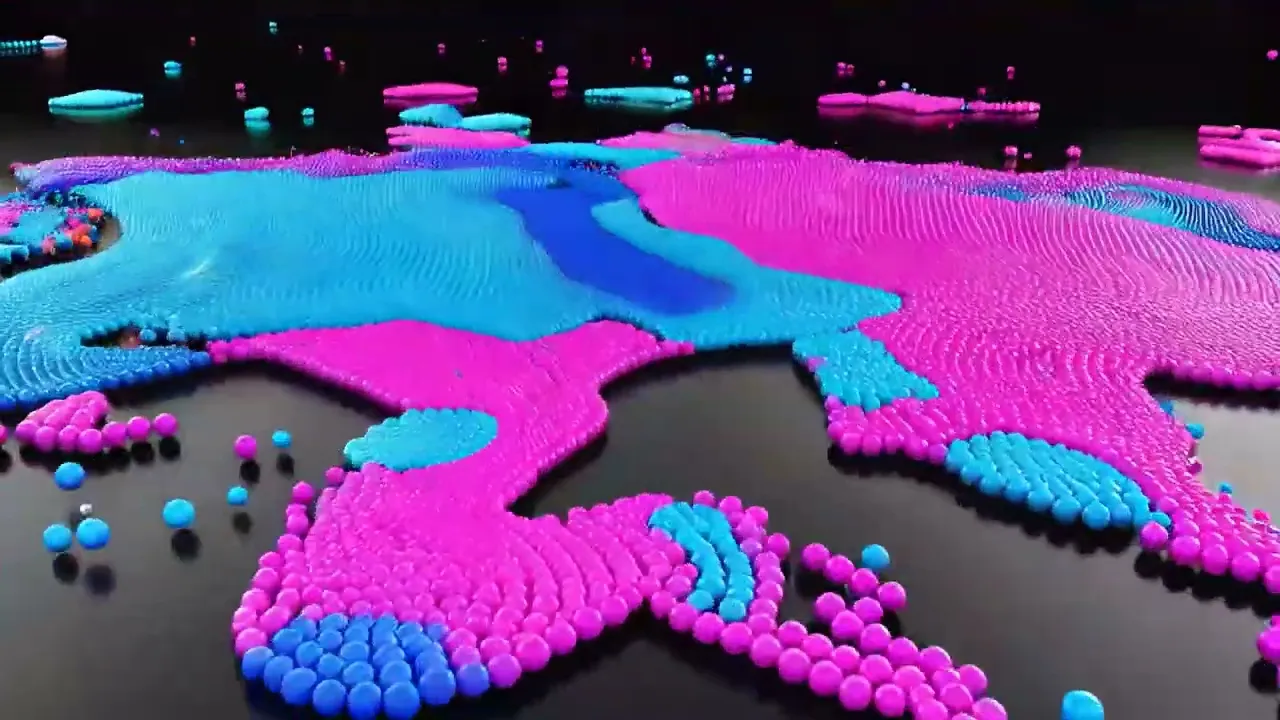
Artists and designers have embraced dimensionality reduction techniques to craft immersive, data-driven experiences that uncover hidden patterns within large datasets. The ability of dimensionality reduction to cluster visually similar digital art pieces, demonstrated in this article, can be applied to vast image collections, as seen in Google's Art and Culture Experiment, the "t-SNE Map." This experiment projected thousands of artworks into an awe-inspiring, interactive 3D landscape, where visually similar pieces cluster together [22]. This approach isn't limited to image datasets; as shown in another Google AI Experiment, "Bird Sounds," in which a sonic landscape was created by grouping similar bird calls, allowing users to explore the intricate world of avian vocalizations [35].
Deepen Your Knowledge: Resources on ML for Data Art & Visualization
🎨 ✨For more examples of incredible artwork utilizing dimensionality reduction and Machine Learning techniques, check out the blog post "AI for Data Art & Data Visualization: From Model to Canvas".
💻 🚀 Dive into the coding in Google Colab with a ready-to-use environment and an extended version of the tutorial code!
📢 📩 Stay Tuned! If you're eager to dive deeper into the fascinating world of AI for Data Art & Visualization, subscribe to our newsletter! You'll get the latest insights, tutorials, and resources delivered straight to your inbox.
Let’s continue exploring how Machine Learning is reshaping the creative landscape of Data Art & Visualization!


Author Bio
Sylwia Nowakowska is a physicist with a Ph.D. in Nanoscience. She has more than 12 years of experience in Research & Development, spanning Physics, Material Science, and Artificial Intelligence. Sylwia has always found joy crafting aesthetic data visualizations, whether for summarizing experiments, presentations, or academic publications. She finds it incredibly satisfying to see complex information become clear and accessible, meaningful, and beautifully represented. This passion led her to found Data Immersion, a platform where she shares her enthusiasm for Data Art & Visualization. When she's not immersed in data, you can find her immersed in water, enjoying swimming, or in the beauty of Swiss mountains, which she captures through her lens.
My Story | Visual CV | LinkedIn | Google Scholar | GitHub
“Curse of dimensionality,” Wikipedia. Feb. 15, 2025. Accessed: Apr. 01, 2025.
“Hands-On Machine Learning with Scikit-Learn, Keras, and TensorFlow, 2nd Edition.” [Book]
“Dimensionality reduction,” Wikipedia. Feb. 02, 2025. Accessed: Apr. 01, 2025.
“Understanding Dimensionality Reduction: PCA vs t-SNE vs UMAP vs FIt-SNE vs LargeVis vs Laplacian…,” Medium. Accessed: Mar. 13, 2025.
“Autoencoder,” Wikipedia. Feb. 11, 2025. Accessed: Apr. 01, 2025.
“Principal component analysis,” Wikipedia. Mar. 04, 2025. Accessed: Apr. 01, 2025.
StatQuest with Josh Starmer, StatQuest: Principal Component Analysis (PCA), Step-by-Step, (Apr. 02, 2018). Accessed: Mar. 13, 2025. [Online Video].
“Understanding UMAP.” Accessed: Mar. 13, 2025.
StatQuest with Josh Starmer, UMAP Dimension Reduction, Main Ideas!!!, (Mar. 07, 2022). Accessed: Apr. 01, 2025. [Online Video].
R. A. Fisher, “Iris.” UCI Machine Learning Repository, 1936. doi: 10.24432/C56C76.
“Tablet NIR spectral data-OpenMV.net Datasets.” Accessed: Apr. 01, 2025.
“Word2vec,” Wikipedia. Mar. 27, 2025. Accessed: Apr. 01, 2025.
“GloVe,” Wikipedia. Jan. 14, 2025. Accessed: Apr. 01, 2025.
“BERT (language model),” Wikipedia. Mar. 19, 2025. Accessed: Apr. 01, 2025.
“State-of-the-art text embedding via the Gemini API- Google Developers Blog.” Accessed: Apr. 01, 2025.
“Vector embeddings - OpenAI API.” Accessed: Apr. 01, 2025.
“sentence-transformers/all-MiniLM-L6-v2 · Hugging Face.” Accessed: Apr. 02, 2025.
L. Fedden, “Comparative Audio Analysis With Wavenet, MFCCs, UMAP, t-SNE and PCA,” Medium. Accessed: Apr. 01, 2025.
“Convolutional Autoencoders | DigitalOcean.” Accessed: Apr. 01, 2025.
Z. Zhang, Z. Pi, and B. Liu, “TROIKA: A General Framework for Heart Rate Monitoring Using Wrist-Type Photoplethysmographic Signals During Intensive Physical Exercise,” IEEE Trans. Biomed. Eng., vol. 62, no. 2, pp. 522–531, Feb. 2015, doi: 10.1109/TBME.2014.2359372.
“Adobe Firefly - Free Generative AI for creatives.” Accessed: Apr. 01, 2025.
“t-SNE Map by Cyril Diagne, Nicolas Barradeau & Simon Doury - Experiments with Google.”
“StandardScaler,” scikit-learn. Accessed: Mar. 27, 2025.
“PCA,” scikit-learn. Accessed: Mar. 27, 2025.
“How to Install Python on Your System: A Guide – Real Python.” Accessed: Apr. 02, 2025.
“Setting up Visual Studio Code.” Accessed: Apr. 01, 2025.
“Installing the classic Jupyter Notebook interface — Jupyter Documentation 4.1.1 alpha documentation.” Accessed: Apr. 02, 2025.
“Jupyter Notebooks in VS Code.” Accessed: Apr. 02, 2025.
“Anaconda Documentation,” Anaconda. Accessed: Apr. 02, 2025.
colab.google. Accessed: Apr. 02, 2025.
“The center for all your data, analytics, and AI – Amazon SageMaker – AWS,” Amazon Web Services, Inc. Accessed: Apr. 02, 2025.
“Create Your Azure Free Account Or Pay As You Go | Microsoft Azure.” Accessed: Apr. 02, 2025.
“IBM Cloud.” Accessed: Apr. 02, 2025.
B. L. Ljubljana University of, “Data Mining.” Accessed: Mar. 17, 2025.
“Bird Sounds by Manny Tan & Kyle McDonald - Experiments with Google.” Accessed: Mar. 13, 2025.
