Deep Learning for Data Art & Visualization: Data Sculpture
Published: Apr 24, 2025

by Sylwia Nowakowska
AI Portfolio
Data Art
AI
Photography


Just before a neural network decides, it whispers in numbers.
Beneath every piece of data a deep learning model processes, a quiet choreography unfolds—neurons lighting up in patterns that guide the artificial intelligence (AI) model toward its output. These activations can be traced, visualized, or even sculpted into a form.
The ‘Machine Perception Choreography’ data sculpture began with my hikes through the breathtaking landscapes of Switzerland, camera in hand. Later, the precise logic of computer vision models reinterpreted the beauty of the captured mountains, lakes, and textures of the wilderness.

Figure 1) The starting point of the ‘Machine Perception Choreography’ data sculpture: hikes through the Swiss landscapes, capturing the beauty of nature that would later be reinterpreted through the lens of machine perception (AI-generated, Adobe Firefly).
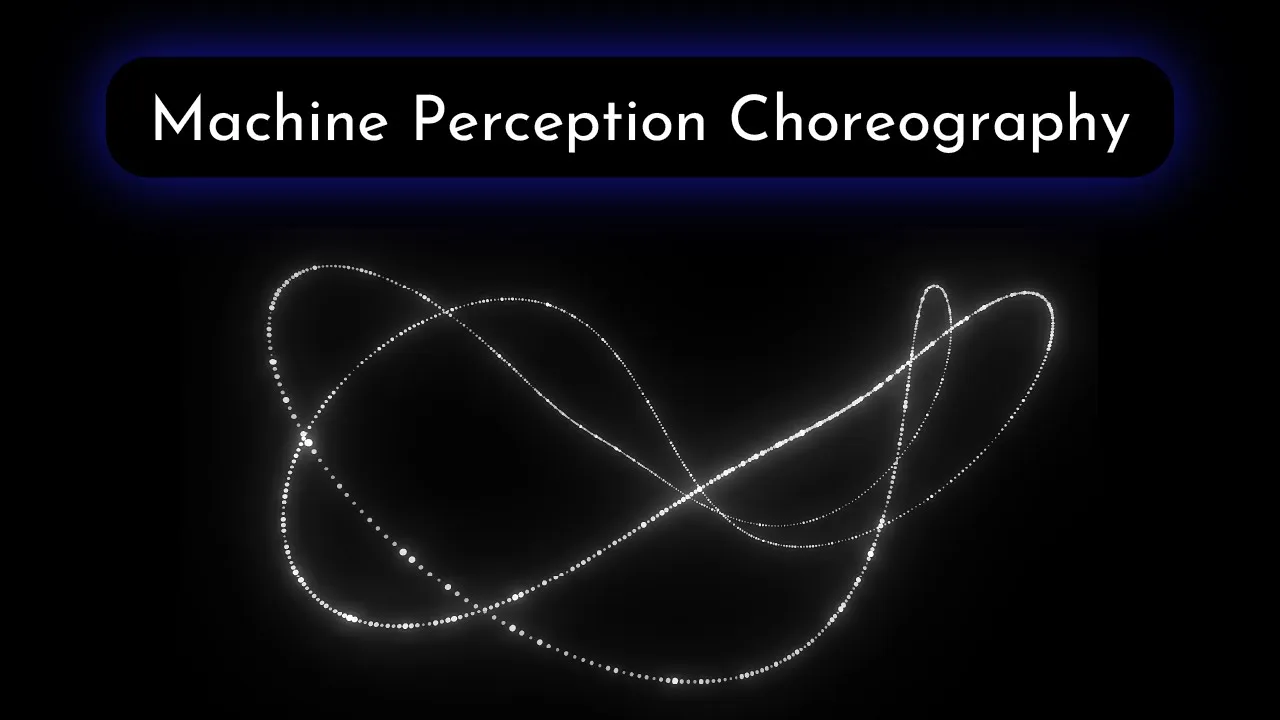
Each photograph's essence, distilled into feature vectors, came alive along two intertwined infinity symbols. Neuron activations, aligned along their curves, map the liminal space between perception and decision—a frozen moment of computation transformed into visual dance.
Join me behind the scenes, where raw neuron activations become data art—and where we explore the worlds of data sculpture, deep learning, and computer vision models that make this transformation possible.
From Data to Form: A Brief Introduction to Data Sculpture
Data sculpture transforms abstract information into sensory experiences, bridging the gap between raw data and human perception. These sculptures can be both physical and digital, each offering a distinct sensory encounter with data.
In the digital world, various algorithms and AI models generate dynamic and often immersive visuals based on carefully curated datasets. Artists like Refik Anadol create fluid media installations that translate data streams into mesmerizing forms [1]. 'Diffusive Alpine Metamorphosis', a data art piece I created, explores how nature, machine and human creativity can can converge to produce an artwork that celebrates the beauty of the natural world.
For physical expression—often called data physicalization [2]—artists use datasets as raw materials for tangible works. This approach is exemplified by Nathalie Miebach’s intricate woven interpretations of scientific data, such as meteorological and oceanographic data, offering deeper insight into natural phenomena [3].
Whether made from pixels or physical materials, data sculptures invite us to feel information and to experience its presence.

Figure 2) AI-generated digital data sculpture representing the transformation of abstract data into a visual form (Adobe Firefly).
Brushes Made of Code: Painting with Deep Learning Models
Deep Learning (DL) is at the heart of many immersive data-driven artworks and today’s most advanced AI systems. As a subfield of Machine Learning (ML), it leverages multi-layered neural networks modeled after the structure of the human brain. These networks are remarkably good at uncovering hidden patterns in vast datasets—especially in areas where nuance is key, such as computer vision, where precise image interpretation is essential. Their capabilities span from technical applications like detecting anatomical structures in medical scans [4], to more creative tasks such as recognizing and extracting patterns in visual arts [5].

Figure 3) Nested subsets of Artificial Intelligence (AI): Machine Learning (ML), Deep Learning (DL), and Generative AI (Gen AI) (adapted from [6]).
For years, Convolutional Neural Networks (CNNs) were the go-to architecture for image-based tasks, praised for their layered structure mimicking how humans process visual information. CNNs have driven advances from facial recognition [7], [8] to autonomous driving [9]. However, a new approach has recently emerged: Vision Transformers (ViTs). Transformer models were initially designed for natural language processing [10], but they have since been successfully adapted for computer vision [11]. These models now rival—and sometimes surpass—CNNs in visual tasks [12], offering a fresh lens on how machines can “see.”
If you're curious how DL models intersect with creative data expression, check out my blog post on AI for Data Art & Data Visualization, which explores how artists use these models to transform data into expressive visuals.
Convolutional Neural Networks (CNNs)
CNNs interpret images by assembling meaning from the ground up—much like studying the delicate textures of a canvas before stepping back to see the whole composition. Convolutional layers first detect low-level features such as edges and textures. These are followed by pooling layers, simplifying the data while preserving its essential elements. This combination of convolution and pooling is repeated in stacked layers, progressively capturing more complex patterns and structures. Eventually, the spatial information from these layers is flattened and processed by a network section composed of fully connected layers. This final part, often referred to as the Multi-Layer Perceptron (MLP), integrates the extracted features to form a holistic understanding of the visual scene [13].
In this project, rather than proceeding to the final classification output, the feature vector generated just before the classification layer was extracted, emphasizing the model's internal representation of each photograph's essence.

Figure 4) Schematic representation of a Convolutional Neural Network (CNN) architecture for image classification. The scissors icon indicates the extraction point of the feature vector, taken just before the final classification layer (AI-generated image of the robot, Adobe Firefly).
Vision Transformers (ViTs)
Unlike CNNs, which process images in a hierarchical and localized manner, Vision Transformers (ViTs) approach visual data more like observing a painting’s overall composition before zooming in on individual brushstrokes. ViTs start by dividing the image into a sequence of fixed-size patches. Each patch is flattened and converted into a linear embedding, treating it similarly to tokens in natural language processing. Positional encodings are added to these embeddings to preserve spatial information. The resulting token sequence is fed into a standard Transformer encoder, which uses self-attention to simultaneously assess the relevance and relationships between all patches. This enables the model to capture long-range dependencies and global context from the beginning. Like CNNs, ViTs usually conclude with an MLP head for downstream tasks [11].
For this project, however, the feature vector was also extracted just before the final classification layer to capture the model's internal representation of each photograph.

Figure 5) Schematic representation of a Vision Transformer (ViT) architecture for image classification, adapted from the original publication [11]. The scissors icon marks the feature vector extraction point (an AI-generated image of the robot, Adobe Firefly).
Machine Perception Choreography: The Creative Process
Photography Dataset
The foundation of the data sculpture is a dataset consisting of 12 of my favorite photographs. These images capture Swiss majestic mountains, serene lakes, and picturesque small villages, each reflecting a quiet moment of awe.

Figure 6) Photography Dataset: A selection of 12 photographs taken during my hikes through Switzerland.
Embeddings extraction and post-processing
The photographed scenery, from the contours of mountains to shimmering waters, was then transformed through the lens of DL models. Using two distinct architectures—a CNN and a ViT—feature vectors (embeddings) were extracted for each photograph, serving as a condensed representation of the image's essence as understood by the models.
The extracted embeddings, i.e. neuron activation intensity values, underwent post-processing to ensure consistency and comparability. This included standardization (centering around zero) and normalization (scaling within a consistent range), essential for meaningful visual representation and downstream mapping onto the defined trajectory. In Figure 7, the extracted are visualized as a heatmap, highlighting the distribution and intensity of neuron activations across both models for each photograph.

Figure 7) Visualization of neural activation intensity within embeddings extracted from Convolutional Neural Network (CNN) and Vision Transformer (ViT) models. The heatmaps depict activation levels across 12 analyzed photographs, with color intensity corresponding to activation strength.
Choreographing Neural Activations

Figure 8) Machine Perception Choreography Data Sculpture: Snapshot of neural activations for one photograph.
To give form to these neural insights, the extracted neuron activations from both models were mapped onto two intertwined, infinity sign-like trajectories. This intertwined design is more than aesthetic; it symbolizes the growing entanglement of AI systems in our lives and represents how increasingly complex and capable AI relies on the collaboration and choreography of multiple powerful models. The data is brought to life on this symbolic structure: the more a specific neuron within the critical final layer is activated when processing an image, the more intensely it "shines" within the data sculpture. The trajectories wave with a mesmerizing motion, mapping a critical "transition zone" between raw machine perception and the model's impending decision—a frozen moment of computation brought into view.
Between Beauty Captured in Photographs and Machine Perception
This project set out to transform raw neural activations into a data sculpture—making the silent workings of deep learning visible. By weaving CNN and ViT embeddings into an intertwined infinity form, we glimpse the hidden structure of machine perception: how AI forms internal representations of the essence of visual data. With every AI leap, we gain new tools to co-create with machines—transforming complexity into shared understanding.
Tools for Sculpting Your Knowledge
📬🧠 Stay Connected, Stay Inspired
Join me at Data Immersion as we explore the evolving intersection of data, art, visualization, and AI. Subscribe to the newsletter for occasional insights, tools, and creative breakthroughs—delivered only when there's something truly worth sharing.
🎨🤖 Explore AI-Driven Creativity
Curious how artists use AI to turn raw data into expressive visuals? Dive into AI for Data Art & Visualization: From Model to Canvas, a blog post filled with real-world examples where deep learning meets artistic imagination.
🎨🖼️ Understand the Landscape
What exactly is data art—and how does it differ from data visualization? Uncover the roots, goals, and creative potential of each in Data Art vs. Data Visualization: A Deep Dive.


Author Bio
Sylwia Nowakowska is a physicist with a Ph.D. in Nanoscience. She has more than 12 years of experience in Research & Development, spanning Physics, Material Science, and Artificial Intelligence. Sylwia has always found joy crafting aesthetic data visualizations, whether for summarizing experiments, presentations, or academic publications. She finds it incredibly satisfying to see complex information become clear and accessible, meaningful, and beautifully represented. This passion led her to found Data Immersion, a platform where she shares her enthusiasm for Data Art & Visualization. When she's not immersed in data, you can find her immersed in water, enjoying swimming, or in the beauty of Swiss mountains, which she captures through her lens.
My Story | Visual CV | LinkedIn | Google Scholar | GitHub
“Refik Anadol Works,” Refik Anadol. Accessed: Feb. 17, 2025.
“Data physicalization,” Wikipedia. Feb. 03, 2025. Accessed: Apr. 22, 2025.
“Nathalie Miebach,” Nathalie Miebach. Accessed: Feb. 17, 2025.
S. Nowakowska et al., “Generalizable attention U-Net for segmentation of fibroglandular tissue and background parenchymal enhancement in breast DCE-MRI,” Insights Imaging, vol. 14, no. 1, p. 185, Nov. 2023.
G. Castellano and G. Vessio, “Deep learning approaches to pattern extraction and recognition in paintings and drawings: an overview,” Neural Comput. Appl., vol. 33, no. 19, pp. 12263–12282, Oct. 2021.
“What Is Artificial Intelligence (AI)? | IBM.” Accessed: Mar. 12, 2025.
Y. Taigman, M. Yang, M. Ranzato, and L. Wolf, “DeepFace: Closing the Gap to Human-Level Performance in Face Verification,” in 2014 IEEE Conference on Computer Vision and Pattern Recognition, Jun. 2014, pp. 1701–1708.
F. Schroff, D. Kalenichenko, and J. Philbin, “FaceNet: A Unified Embedding for Face Recognition and Clustering,” in 2015 IEEE Conference on Computer Vision and Pattern Recognition (CVPR), Jun. 2015, pp. 815–823.
M. Bojarski et al., “End to End Learning for Self-Driving Cars,” Apr. 25, 2016, arXiv: arXiv:1604.07316.
A. Vaswani et al., “Attention Is All You Need,” Aug. 02, 2023, arXiv: arXiv:1706.03762.
A. Dosovitskiy et al., “An Image is Worth 16x16 Words: Transformers for Image Recognition at Scale,” Jun. 03, 2021, arXiv: arXiv:2010.11929.
J. Maurício, I. Domingues, and J. Bernardino, “Comparing Vision Transformers and Convolutional Neural Networks for Image Classification: A Literature Review,” Appl. Sci., vol. 13, no. 9, Art. no. 9, Jan. 2023.
“Convolutional neural network,” Wikipedia. Mar. 18, 2025. Accessed: Mar. 19, 2025.
